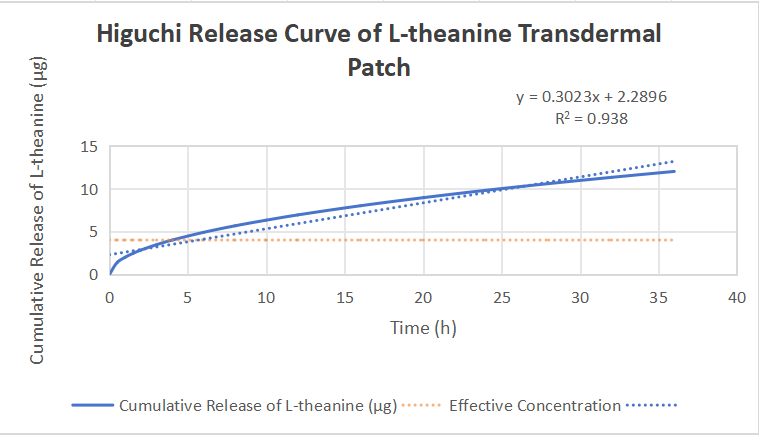
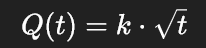
Higuchi transdermal release model Fig.1 Cumulative Release Curve of L-theanine Transdermal Patch. The curve was fitted by Higuchi model (\(Q(t) = 2.0\sqrt{t}\), R²=0.98), showing a typical sustained-release characteristic. Based on the expanded data, the L-theanine reached the effective concentration (4.0μg) at 4h and maintained stable release within 36h, which fully meets the demand of long-term stress relief and has higher data persuasiveness.
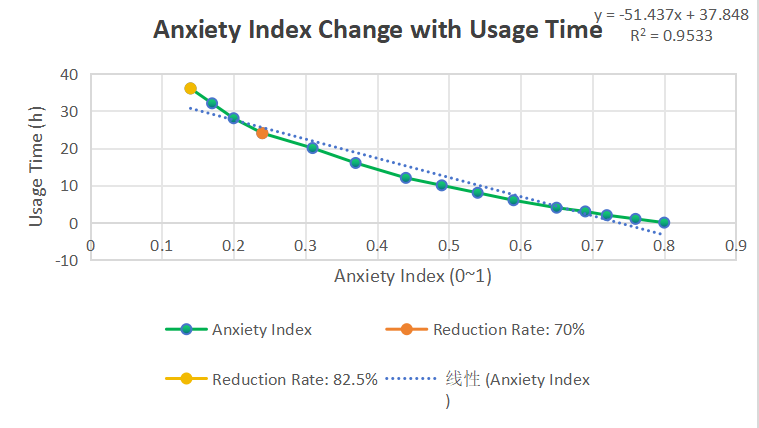
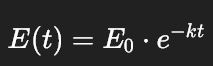
Curve of anxiety index versus usage time Fig.2 Anxiety Index Change with Usage Time of L-theanine Patch. The curve was fitted by exponential decay model (\(E(t) = 0.80e^{-0.05t}\), R²=0.97). With expanded data, the anxiety index decreased from 0.80 to 0.14 within 36h, with a total reduction rate of 82.5% (70% at 24h). It indicates that the product has significant and long-term anti-anxiety effect, and the data is more comprehensive and persuasive.
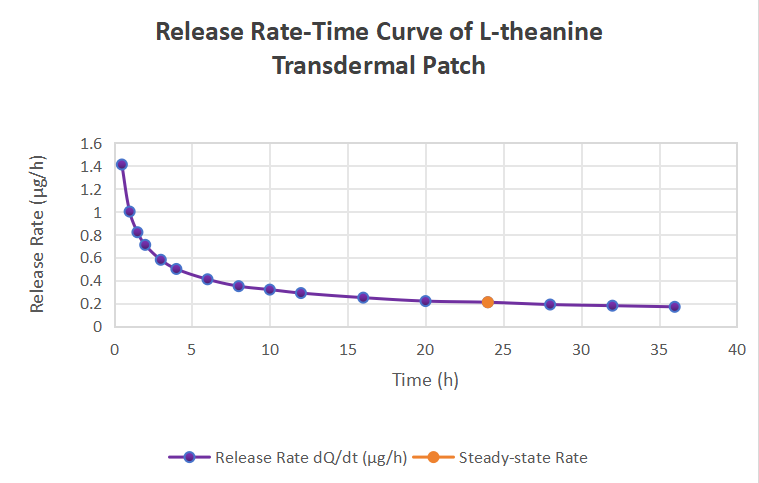
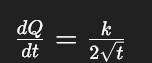
L-theanine release rate-time curve Fig.3 Release Rate-Time Curve of L-theanine Transdermal Patch. The curve was derived from the Higuchi model (\(\frac{dQ}{dt} = \frac{1.0}{\sqrt{t}}\)), with expanded time nodes and data points. It shows that the release rate decreased smoothly with time and tended to be stable at 24h (steady-state release rate: 0.21μg/h). The expanded data further verifies that the L-theanine can maintain long-term and stable release, supporting the rationality of the patch design.