Experiment
Wet Lab
1. Objectives
To validate the functionality of the dual-target "AND" gate detection system based on RNA aptamers under in vitro conditions, with the final readout based on colloidal gold lateral flow test strips. Specific aims include:
- Validate OFF-state blocking efficiency (RNA1 binding stability to the T7 promoter)
- Validate ON-state activation efficiency (sgRNA production upon simultaneous presence of NFL and GFAP)
- Establish colloidal gold labeling system and assemble test strips
- Determine sensitivity, specificity, and limit of detection
All experiments are in vitro, involving no animal or human subjects, in compliance with iGEM ethical guidelines.
2. Experimental Overview
| Experiment | Objective | Expected Result |
|---|---|---|
| Exp 1: In vitro transcription validation | Validate RNA1 binding to T7 promoter and target-dependent dissociation | Only NFL+GFAP group shows RNA1 dissociation |
| Exp 2: Colloidal gold labeling and test strip assembly | Prepare colloidal gold conjugates and assemble test strips | Uniform gold particles, labeling efficiency >80%, intact test strips |
| Exp 3: Functional validation | Validate test strip specificity for dual-target detection | Only dual-target group shows T line + C line; single-target/no-target groups show C line only |
| Exp 4: Sensitivity determination | Determine minimum detectable concentration | LOD approximates predicted value of 0.57 pM |
| Exp 5: Cross-reactivity testing | Verify specificity against non-target proteins | Non-target proteins do not induce T line coloration |
| Exp 6: Simulated blood sample testing | Evaluate performance in complex matrix | Results consistent with buffer system |
3. Detailed Experimental Design
Experiment 1: In Vitro Transcription Validation of OFF/ON States
Electrophoretic mobility shift assay (EMSA) will be used to validate RNA1 binding to T7 promoter DNA. Four experimental groups will be tested: no target, NFL only, GFAP only, and NFL+GFAP (10 nM each), along with blank control (no RNA1) and negative control (irrelevant protein). Only the NFL+GFAP group is expected to show a shifted band indicating RNA1 release from the T7 promoter, demonstrating dual-target-dependent OFF/ON switching.
Experiment 2: Colloidal Gold Labeling and Test Strip Assembly
Colloidal gold particles will be prepared using the sodium citrate reduction method. Reporter probes (RNA probes labeled with biotin and FITC) will be conjugated to the gold nanoparticles. Particle uniformity (20–40 nm diameter) will be examined by transmission electron microscopy (TEM), and labeling efficiency (>80%) will be determined by UV-Vis spectrophotometry. Conjugates will be sprayed onto conjugate pads. On the NC membrane, the T line (detection line) will be coated with streptavidin (to capture intact probes), and the C line (control line) will be coated with anti-FITC antibodies (to capture gold-labeled antibodies). Test strips will be assembled with sample pad, conjugate pad, NC membrane, and absorbent pad.
Experiment 3: Functional Validation
Samples with different target combinations will be prepared in buffer system: no target, NFL only, GFAP only, and NFL+GFAP (10 nM each). Samples will be mixed with detection reagents (containing Cas13, sgRNA, etc.), incubated at 37°C for 30 minutes, applied to test strips, and visually read after 15 minutes. Only the NFL+GFAP group is expected to show both T line and C line, while all other groups should show C line only. Interpretation Logic: T line visibility indicates intact reporter probe (negative); T line absence indicates probe cleavage by Cas13 (positive).
Experiment 4: Sensitivity and Limit of Detection (LOD)
A concentration gradient of NFL+GFAP samples (0, 0.1, 0.5, 1, 5, 10, 50 nM) will be tested following the same procedure. The lowest concentration with visible T line will be determined by visual inspection, and T line intensity will be quantified using a colloidal gold reader. The LOD is expected to approximate the predicted value of 0.57 pM, with T line intensity positively correlated with concentration within the 1–10 nM range.
Experiment 5: Cross-Reactivity Testing
Non-target neuro-related proteins including p-tau217, α-synuclein, and BD-Tau (10 nM each) will be tested following the same procedure. None of the non-target proteins are expected to induce T line coloration (only C line visible), confirming test strip specificity.
Experiment 6: Simulated Blood Sample Testing
Target protein samples (0, 1, 10 nM) will be prepared in commercial simulated blood buffer to evaluate performance in a complex matrix. Results are expected to be consistent with those obtained in buffer system, with no significant matrix interference.
4. Ethical Compliance
In accordance with iGEM safety policies:
- No human subjects: All tests use commercially purified proteins and simulated blood buffer; no real human samples are involved
- No animal experiments: The experimental design does not involve any animal models
- No live bacteria release: Engineered bacteria are used only in closed fermenters; the final product consists of purified reagents and non-living test strips
- Biosafety level: All operations will be performed in a BSL‑1 laboratory, and waste will be autoclaved before disposal
If validation using real human blood samples becomes necessary in the future, a Check-In Form will be submitted to the iGEM Safety Committee for approval in advance.
5. Data Recording and Interpretation Criteria
- All test strip images, grayscale values, and electrophoresis images will be archived
- Each experiment will be performed with at least three replicates; data will be presented as mean ± SD
- Interpretation criteria:
- Positive: T line visible (regardless of intensity) + C line visible
- Negative: Only C line visible
- Invalid: C line absent
6. Experimental Timeline
- Weeks 1–2: Colloidal gold preparation and labeling optimization (10 days)
- Week 3: Test strip assembly and quality control (5 days)
- Week 4: Functional validation (5 days)
- Week 5: Sensitivity and cross-reactivity testing (5 days)
- Week 6: Simulated blood sample testing (3 days)
- Week 7: Data analysis and summary (3 days)
Dry Lab (Modeling)
1. OFF-State Validation
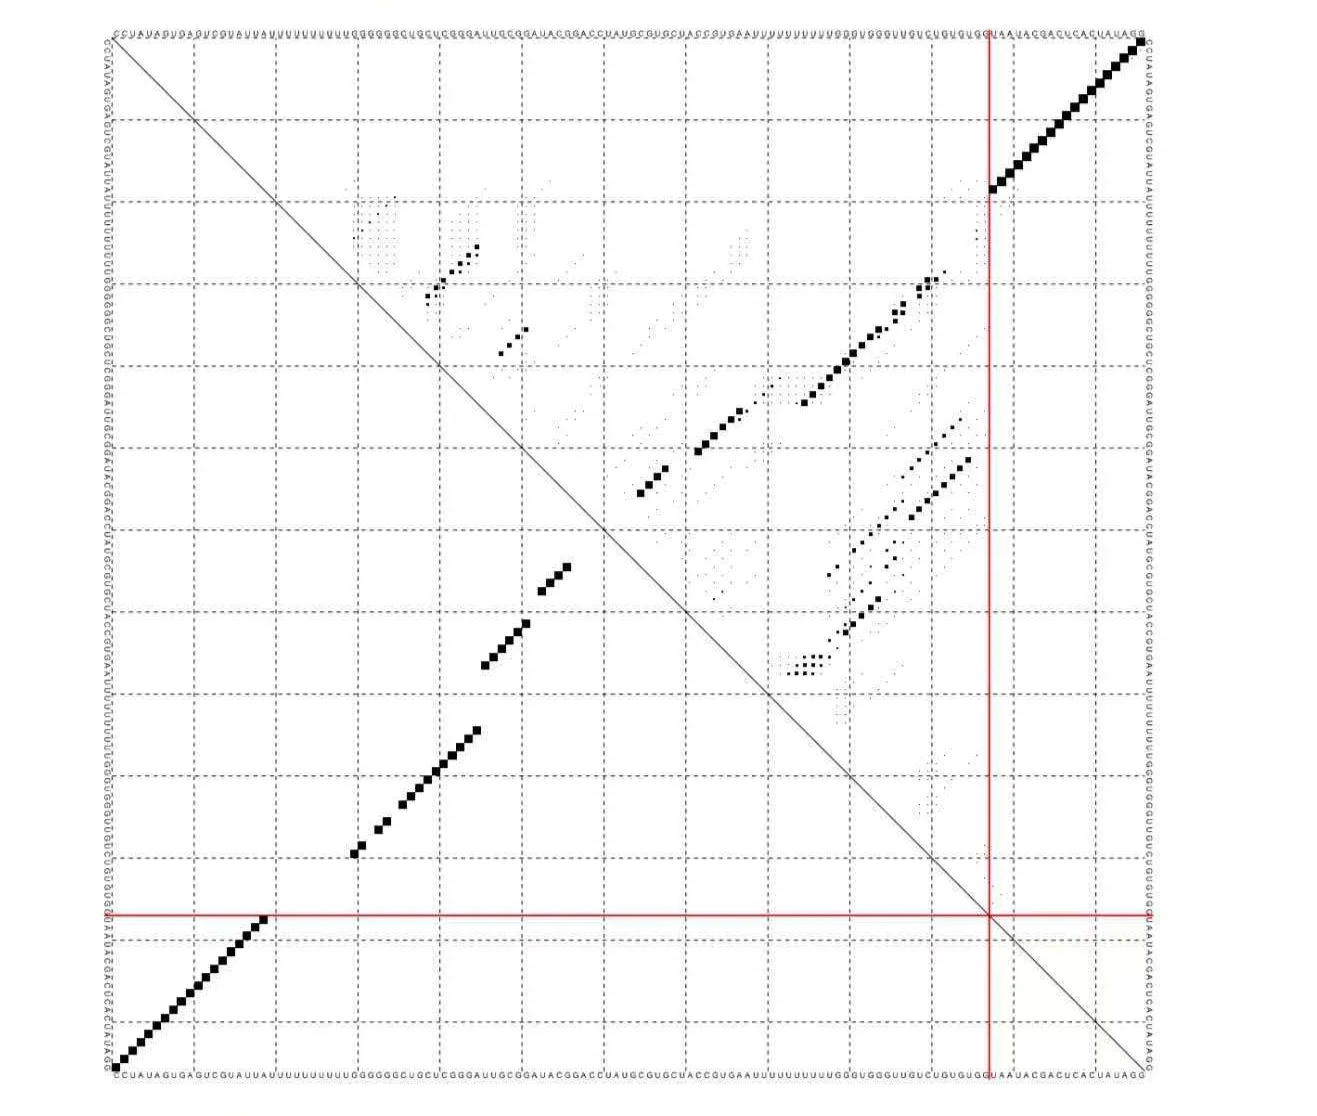
We used ViennaRNA's RNAcofold to simulate the interaction between RNA1 and the T7 promoter DNA. The results show that the T7 complementary region of RNA1 forms a stable duplex with the DNA strand, confirming that in the absence of target proteins, RNA1 can effectively bind to the T7 promoter and block transcription.
Binding free energy: ΔG = -27.35 kcal/mol
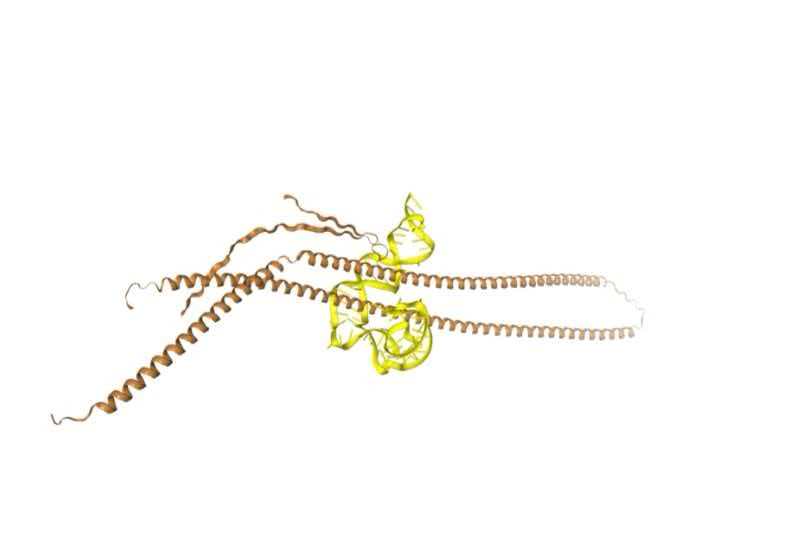
2. Molecular Docking
We performed molecular docking using HDOCK to validate the binding of NFL and GFAP aptamers to their respective target proteins. The results show reliable binding modes for both.
HDOCK scores
NFL aptamer docking score: -288.23
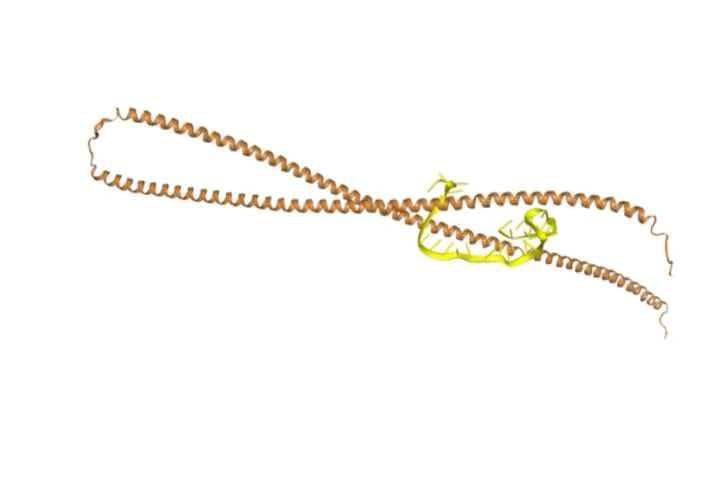
GFAP aptamer docking score: -301.91
3. AND Gate Validation
We developed an ordinary differential equation (ODE) model to simulate sgRNA production kinetics under four conditions, validating the "AND" gate logic.
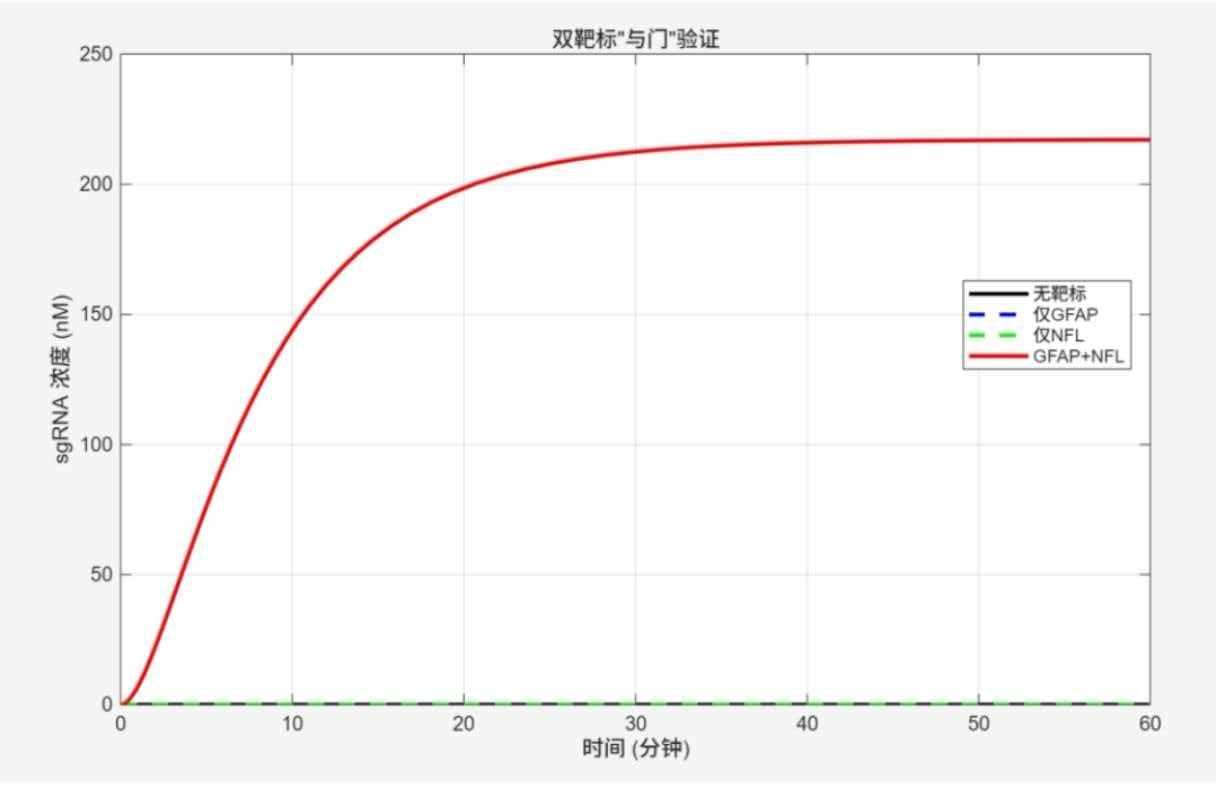
Figure legend: sgRNA is significantly generated only when both GFAP and NFL are present (red curve).
Conclusion: When the sample contains GFAP only or NFL only, sgRNA concentration remains near zero. Only when both GFAP and NFL are present does sgRNA accumulate significantly, reaching approximately 200 nM within 60 minutes. This strictly validates the "AND" gate logic.
4. Detection Performance
The dose–response curve shows that the system achieves a limit of detection (LOD) of 0.57 pM, with a linear response range of 1–10 nM, fully covering the clinically relevant concentration range in Alzheimer's disease patients.
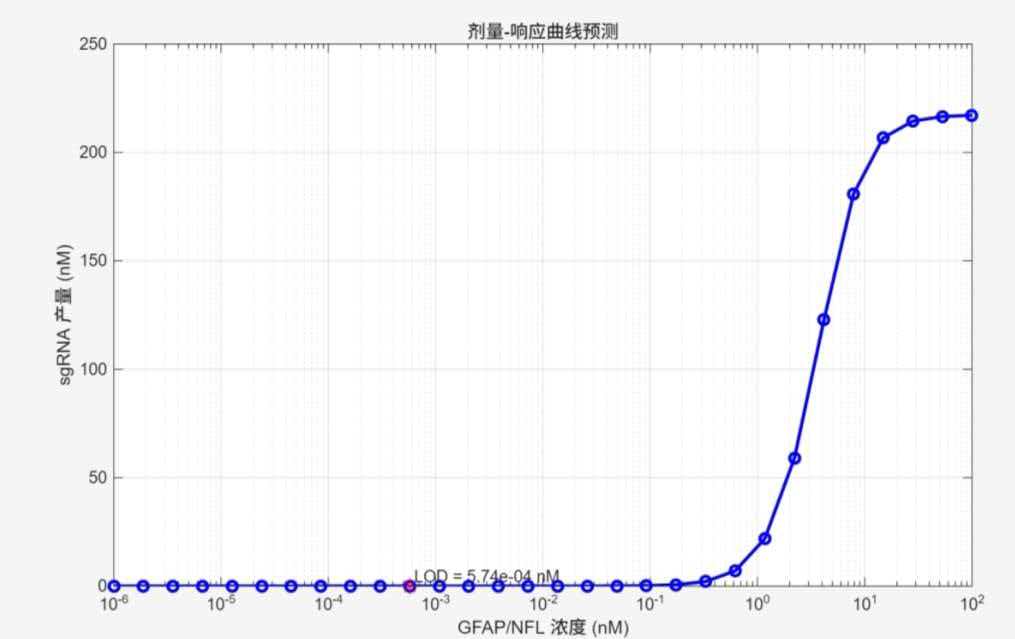
Figure legend: LOD = 0.57 pM
5. Parameter Sensitivity Analysis
We evaluated the impact of four key parameters on system performance.
k_on sensitivity analysis
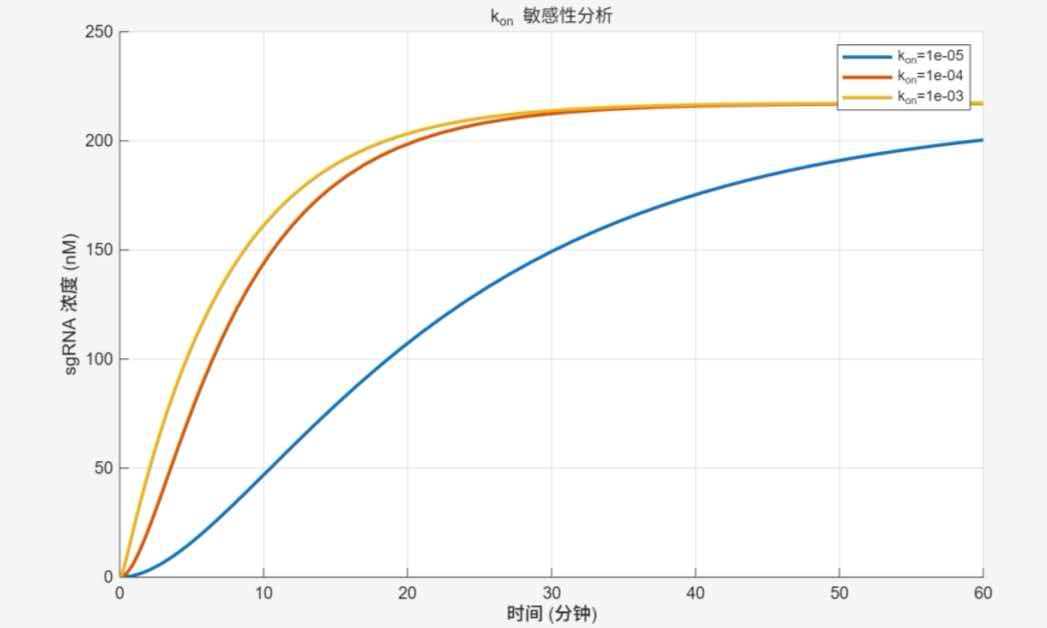
Trends and interpretation: Higher k_on leads to faster response and shorter time to saturation. The yellow curve (k_on = 10⁻³) reaches 200 nM at ~10 min; the blue curve (k_on = 10⁻⁵) reaches 200 nM at 60 min. Final saturation concentrations are similar (210–220 nM), indicating that k_on mainly affects response speed, not maximum yield.
k_off sensitivity analysis
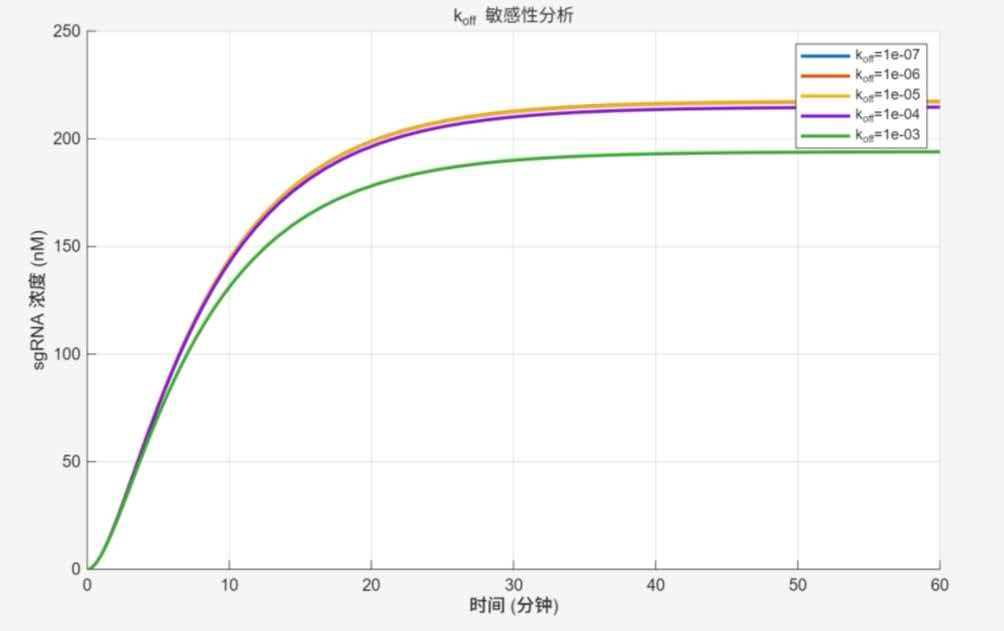
Trends and interpretation: Lower k_off results in more stable complexes, faster curve rise, and higher saturation. Curves with k_off ≤ 10⁻⁵ almost overlap, reaching 210–220 nM at 30 min; at k_off = 10⁻³, response is slowest with saturation at ~190 nM. Reducing k_off enhances target–aptamer stability and response efficiency; excessive k_off significantly degrades performance.
k_tx sensitivity analysis
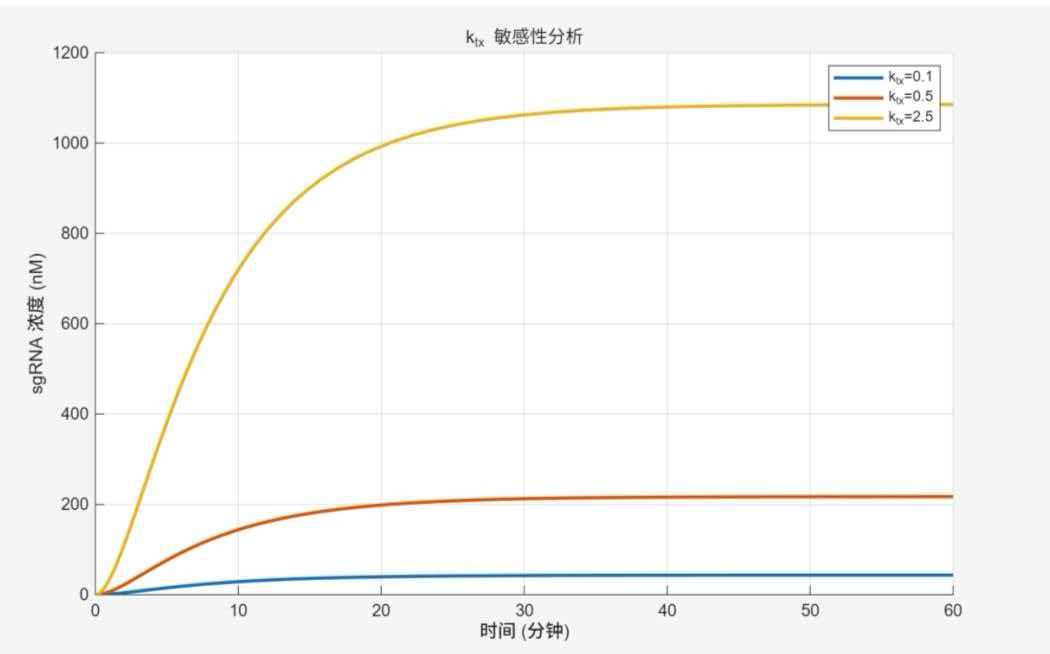
Trends and interpretation: Higher k_tx leads to faster rise and higher saturation. Yellow curve (k_tx = 2.5) rises rapidly, reaching 1100 nM at 30 min; red curve (k_tx = 0.5) reaches 210 nM at 40 min; blue curve (k_tx = 0.1) reaches only ~50 nM at 60 min. k_tx is a key lever for signal amplification.
RNA degradation rate (γ) sensitivity analysis
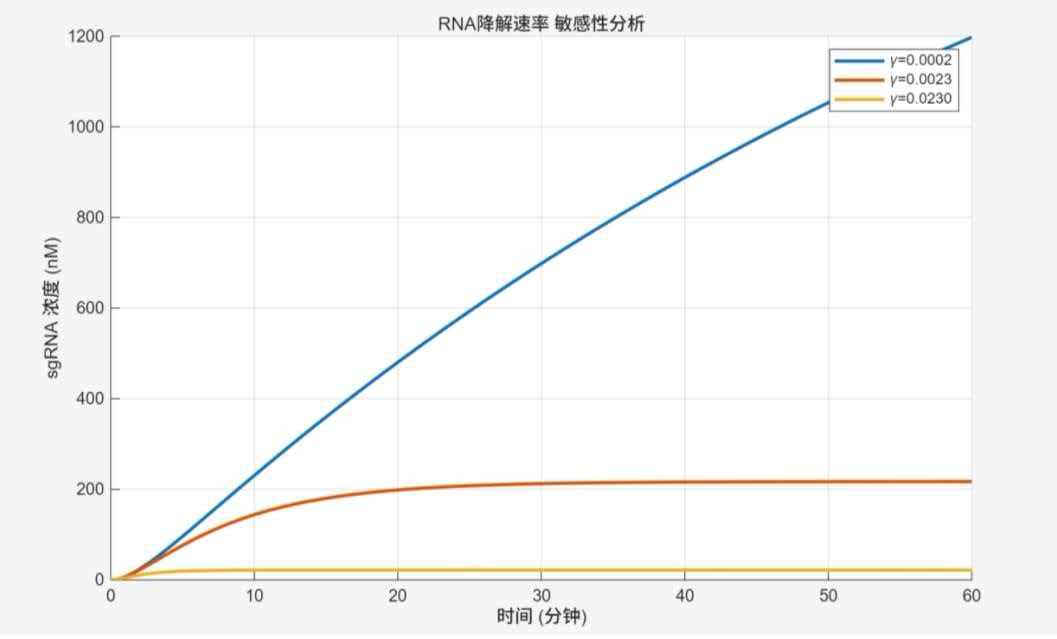
Trends and interpretation: Smaller γ leads to nearly linear sgRNA accumulation (blue curve reaches 1200 nM at 60 min). As γ increases, curves become S-shaped with saturation (red curve saturates at 210 nM at 20 min); excessively high γ results in negligible accumulation (yellow curve). sgRNA stability is the ultimate determinant of signal strength.